
S&P 500 Sets Record High, Eyes Fed Meeting for Policy Cues
XAU/USD
Prediction: Increase with signs of correction
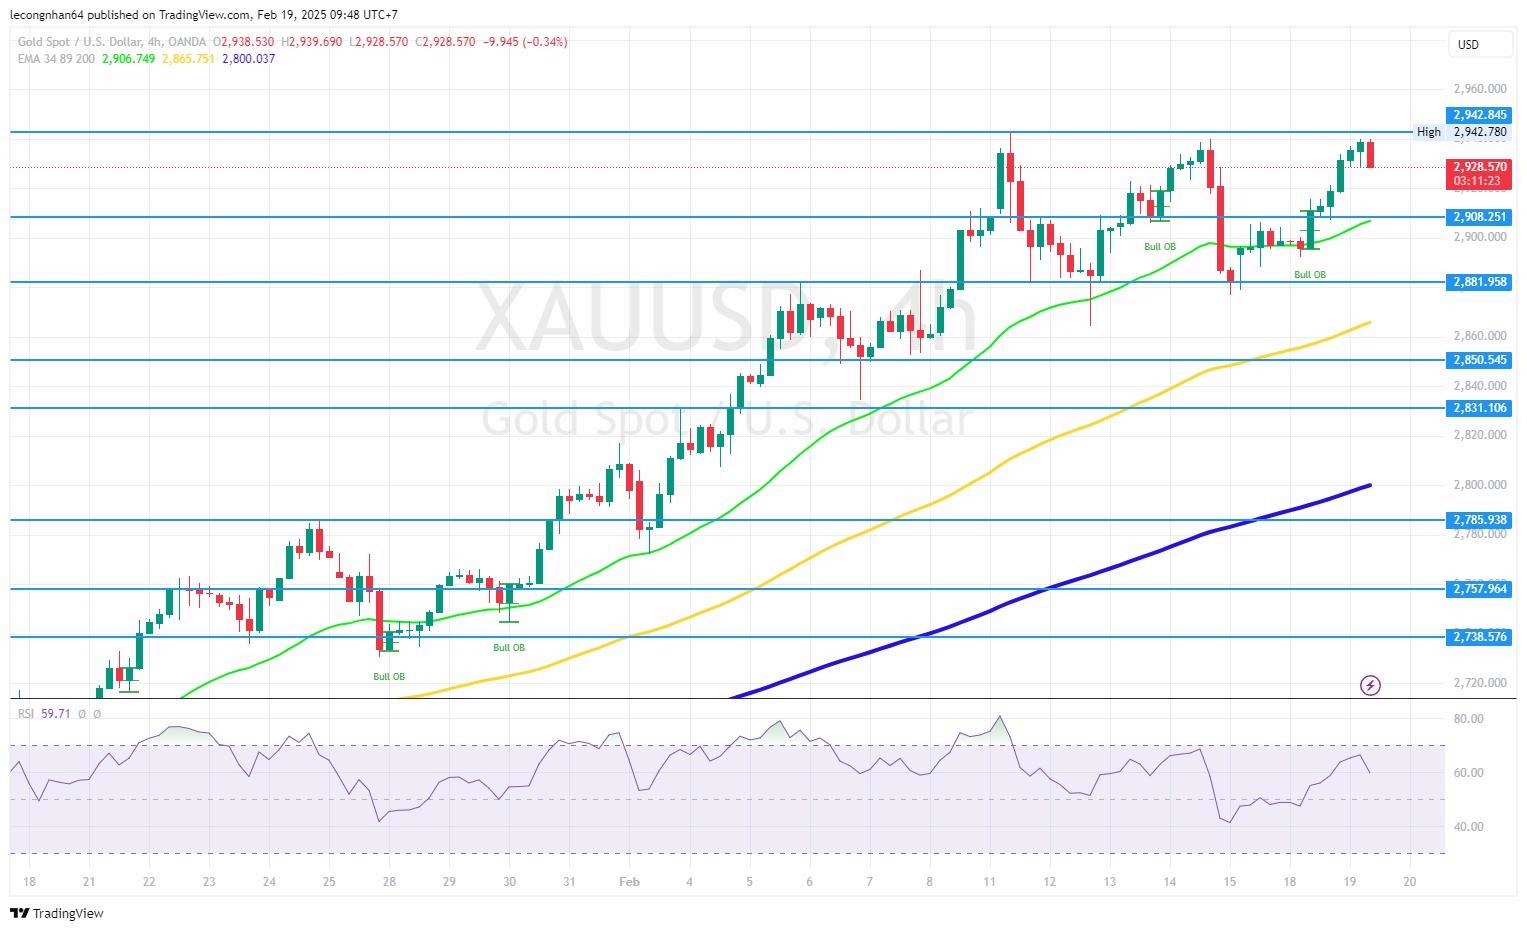
Gold remains in a strong uptrend, approaching the historical peak of $2,942.780, but is currently facing short-term correction pressure. Spot gold is hovering around $2,932, down 0.1% in the Asian session. Investors are closely monitoring macroeconomic factors, particularly U.S. trade policies and the Fed meeting minutes.
FUNDAMENTAL ANALYSIS
Monetary Policy & Fed Impact
San Francisco Fed President Mary Daly stated that inflation remains volatile and requires more time for a clearer trend. This reinforces expectations that the Fed will maintain current interest rates for an extended period.
The market is awaiting the Fed’s January meeting minutes, set to be released today, for further signals on future monetary policy. If the Fed maintains its hawkish stance, gold may face downward pressure.
Bond Yields & USD Strength
The U.S. 10-year Treasury yield has risen to 4.543%, while the 2-year yield reached 4.303%. The DXY index increased by 0.52 points to 107.1, rebounding from its lowest level since February 14.
The recovery of the USD could temporarily pressure gold prices.
U.S. Trade Policy Impact
Former President Donald Trump announced plans to impose a 25% tariff on imported cars, along with higher tariffs on semiconductors and pharmaceuticals. This follows the 10% tariff recently placed on Chinese imports.
These protectionist trade policies escalate global trade tensions, increasing demand for gold as a safe-haven asset.
Geopolitical & Market Sentiment
The Trump administration unexpectedly agreed to talks with Russia regarding the Ukraine war, raising uncertainty about U.S. strategy in the region.
U.S.-EU relations are also strained due to tariff threats, heightening investor concerns about global economic growth.
TECHNICAL ANALYSIS
Key Resistance Levels
● $2,942.845 – Recent peak; a breakout could push prices toward $2,960 - $2,975.
● $2,952.40 – COMEX gold futures are trending slightly higher, signaling expectations of further gains.
Key Support Levels
● $2,908.251 – Closest support, aligning with EMA 34; holding above this level could sustain the uptrend.
● $2,881.958 – Stronger support, coinciding with previous major buying zones.
● $2,850.545 – Critical support level; a bounce from here could trigger renewed buying interest.
EMA: EMA 34 ($2,906.749) & EMA 89 ($2,865.751) – Price remains above both moving averages, confirming a strong uptrend.
RSI: 59.71 – Not yet in overbought territory, but showing signs of weakening momentum; watch price action around $2,942.
Trading volume: remains high; if sustained, it could help break previous highs.
Gold is still in a strong uptrend, but faces short-term correction risks due to rising U.S. bond yields and USD strength. Investors should closely watch the Fed minutes and any developments in U.S. trade policies for potential market shifts. If gold breaks above $2,942, further gains toward $2,960 - $2,975 are possible. Conversely, a drop below $2,908 could signal a deeper correction.
BTCUSD
Prediction: Sideways
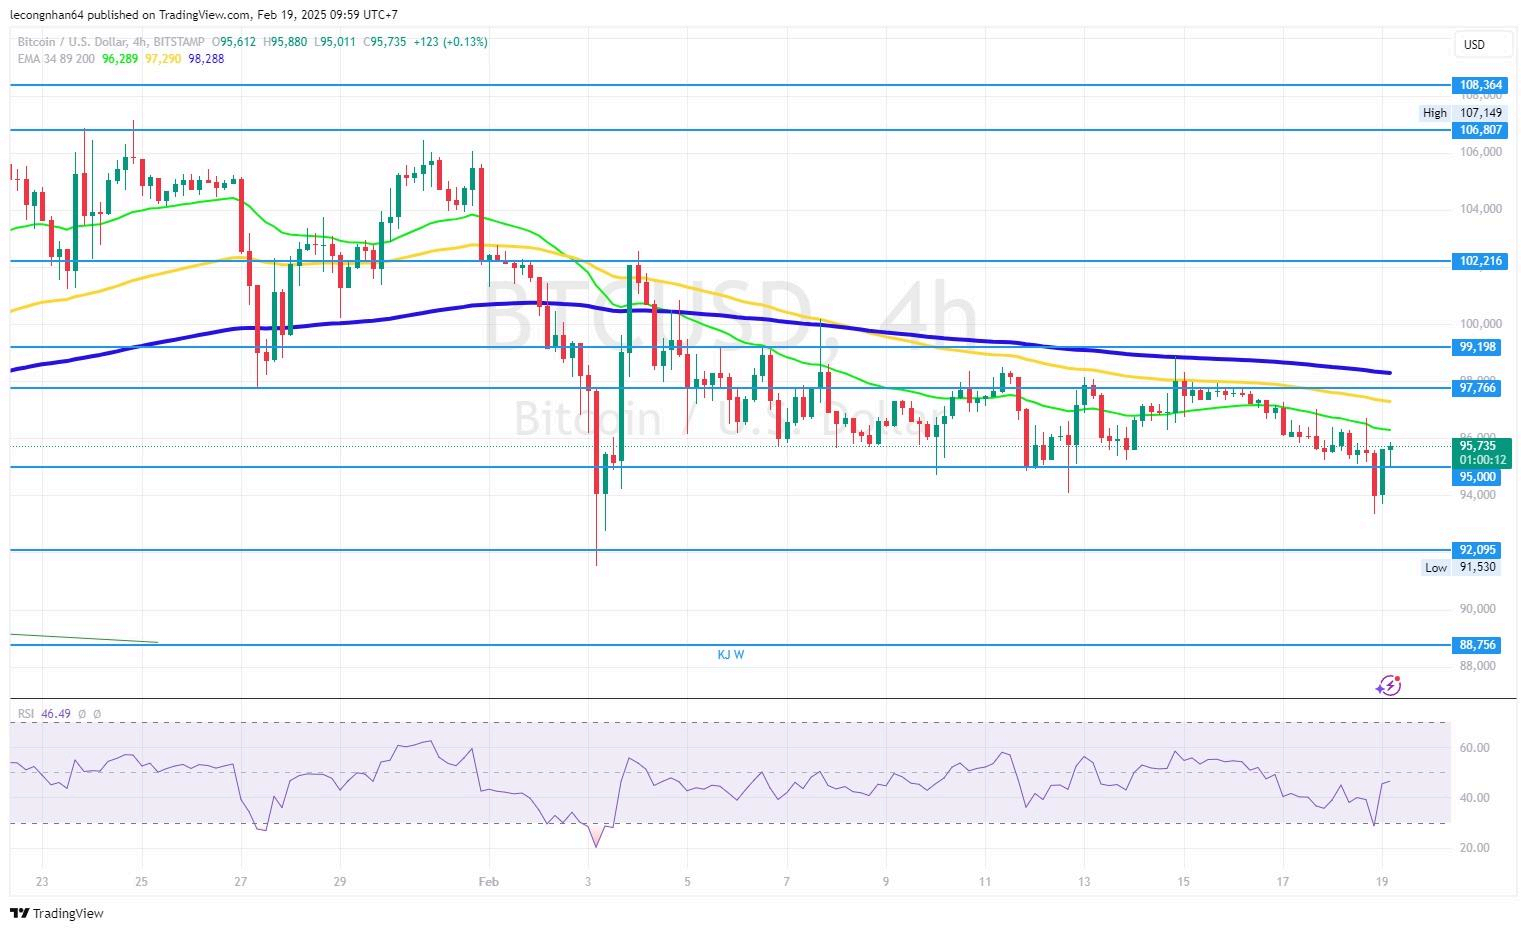
Bitcoin remains in a downtrend on the 4H timeframe, with price still trading below key moving averages. However, BTC is rebounding from the $95,000 support and may retest resistance levels in the near term.
FUNDAMENTAL ANALYSIS
MicroStrategy (now Strategy) Raises $2B for Bitcoin Purchase
Strategy (formerly MicroStrategy) announced plans to issue $2 billion in convertible bonds to acquire more Bitcoin.
The company has used this strategy multiple times to increase its BTC holdings, currently owning 478,740 BTC at an average cost of $65,033 per BTC.
This capital raise could have a long-term bullish effect on Bitcoin, as Strategy's buying activity increases demand.
MSTR Stock Performance & Bitcoin Market Impact
MSTR stock closed down 1.1% on February 18, showing little reaction to the bond issuance news.
Despite reporting a $670.8 million net loss in Q4 2024, Strategy remains "maximalist bullish" and continues its aggressive Bitcoin accumulation strategy.
Bitcoin is currently trading around $95,000, experiencing a mild correction after its strong early-year rally.
Market Sentiment & Investor Reactions
Strategy’s continued BTC accumulation could boost market sentiment, but also raises concerns about the sustainability of this strategy.
If BTC stays below $100,000, Strategy may continue accumulating at a more favorable price. However, downside risks remain, especially if profit-taking pressure increases among investors.
TECHNICAL ANALYSIS
Key Resistance Levels
● $97,766 – Nearest resistance level.
● $99,198 – Next key resistance, near the EMA 200; a breakout could lead to a test of $102,216.
● $102,216 - $106,807 – Strong resistance zone; a decisive move above this level could confirm a bullish breakout.
Key Support Levels
● $95,000 – Crucial support; BTC recently rebounded from this level.
● $92,095 – Major historical support, tested multiple times since November 2024.
RSI: 46.49 – Recovering from oversold territory, indicating buying pressure is returning. If RSI surpasses 50, BTC could attempt to test higher resistance levels.
Trading Volume: No significant volume spike, suggesting BTC is still in an accumulation phase. If BTC holds above $95,000 and volume increases, a recovery toward $97,766 - $99,198 is likely. If BTC breaks below $95,000, further downside toward $92,095 - $88,756 is possible.
Bitcoin is currently range-bound, consolidating near $95,000. A break above $97,766 could signal further upside toward $99,198 - $102,216. However, if BTC falls below $95,000, the next major support lies at $92,095. Short-term traders should watch volume dynamics and RSI movements, while long-term investors might view pullbacks as buying opportunities, especially with Strategy’s continued accumulation.
S&P 500 (SPX)
Prediction: Increase
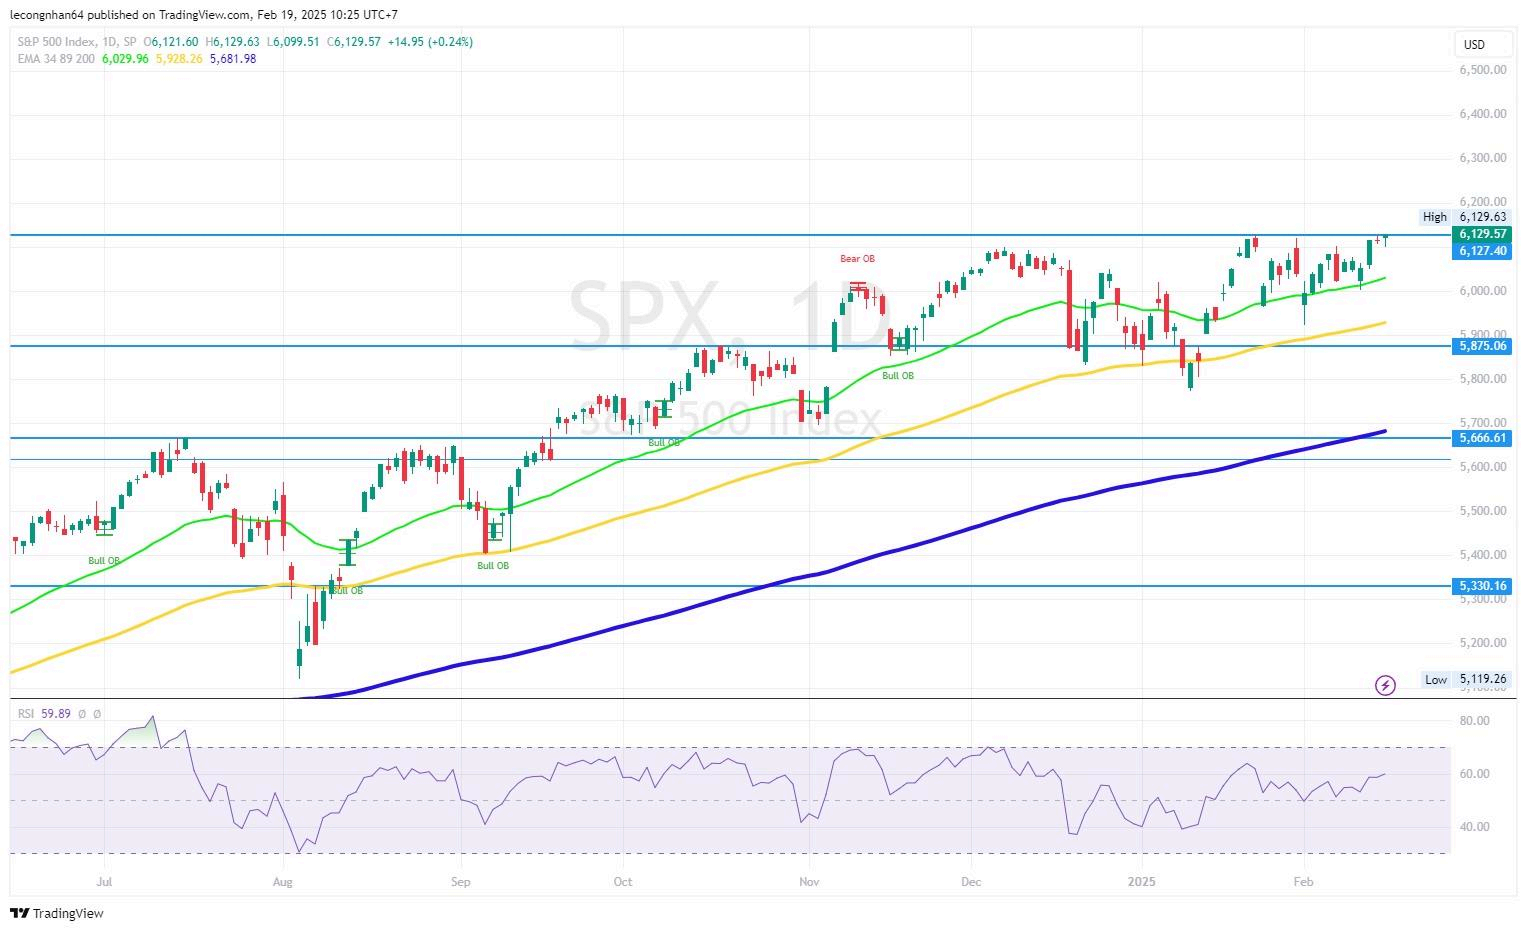
The S&P 500 closed at a record high of 6,129.6, maintaining its uptrend as the market awaits the Fed's January policy meeting minutes. The rally was supported by energy and financial sectors, while communication services lagged behind.
Despite intraday volatility, the index finished in positive territory, reflecting investor optimism. However, the U.S. 10-year Treasury yield rose to 4.56%, which could pressure equities if high interest rates persist.
FUNDAMENTAL ANALYSIS
Monetary Policy & Fed Impact
The Fed’s January meeting minutes, set for release on Wednesday, will provide further insights into upcoming policy decisions.
The Fed has paused rate cuts after three consecutive reductions, citing persistent inflation concerns.
Fed Chair Jerome Powell emphasized that there's no rush to adjust interest rates, which may
delay rate-cut expectations.
Policymakers like Patrick Harker, Michelle Bowman, and Christopher Waller believe the economy remains strong enough for the Fed to hold off on easing policy.
Bond Yields & Market Dynamics
The 10-year U.S. Treasury yield climbed to 4.56%, reflecting expectations that the Fed may keep rates elevated longer.
Higher bond yields can reduce the attractiveness of equities compared to fixed-income assets.
Economic Data Impact
U.S. homebuilder confidence dropped to a five-month low due to concerns over tariffs and rising housing costs.
The New York manufacturing index surged unexpectedly, signaling a recovery in industrial activity.
Earnings Reports Impact
The Q4 earnings season is nearing completion, with 74% of S&P 500 companies beating expectations.
Intel (INTC) surged 16%, leading the Nasdaq after reports that Broadcom and TSMC are considering a corporate restructuring.
Meta Platforms (META) fell 2.8%, ending a 20-session winning streak.
Constellation Brands (STZ) gained 4% after Berkshire Hathaway disclosed an investment in the company.
TECHNICAL ANALYSIS
Key Resistance Levels
● 6,127 - 6,130 – All-time high; a breakout could push SPX toward 6,200.
● 6,200+ – If momentum remains strong, SPX may extend gains toward higher levels.
Key Support Levels
● 5,930 – Closest support, aligning with the EMA 89.
● 5,696 – Stronger support, near the EMA 200.
EMA: EMA 34, EMA 89, EMA 200 – The index remains above all key moving averages, confirming a strong uptrend. The EMA 89 at 5,928 serves as dynamic support.
RSI: 59.89 – In neutral territory but trending upward. If RSI surpasses 65-70, it may signal overbought conditions. A drop below 50 could indicate a weakening uptrend.
Trading Volume: 16.36 billion shares, above the 20-day average of 15.57 billion, indicating strong market participation.
The S&P 500 remains in an uptrend, supported by strong earnings, economic resilience, and bullish technicals. However, rising bond yields and Fed uncertainty could introduce short-term volatility.
A break above 6,130 could drive further gains toward 6,200, while a pullback to 5,930 or 5,696 may offer buying opportunities. Investors should monitor Fed meeting minutes, bond yields, and key resistance levels for confirmation of the next move.
Disclaimer
Derivative investments involve significant risks and may result in the loss of the capital you invest. You are advised to carefully read and study the legality of the company, products, and trading rules before deciding to invest your money. Be responsible and accountable in your trading.
RISK WARNING IN TRADING
Transactions via margin involve products that use leverage mechanisms, carry high risks, and are certainly not suitable for all investors. THERE IS NO GUARANTEE OF PROFIT on your investment, so be wary of those who guarantee profits in trading. You are advised not to use funds if you are not prepared to incur losses. Before deciding to trade, ensure that you understand the risks involved and also consider your experience.