
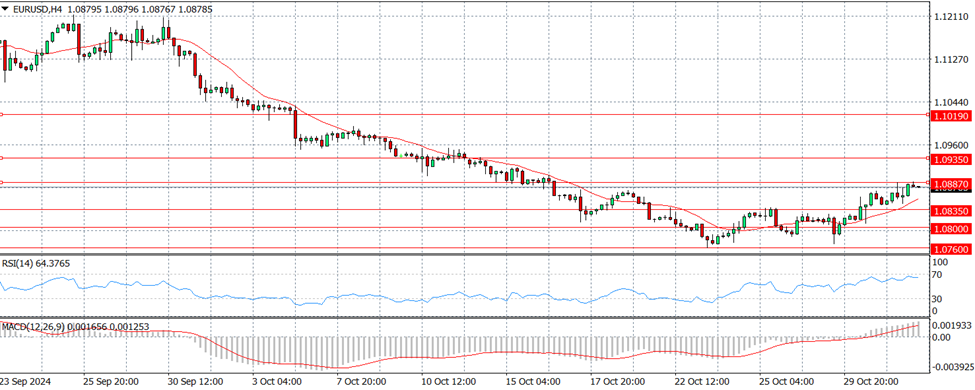
EUR/USD Climbs to 1.0885 as U.S. Dollar Weakens Ahead of NFP Data

EURUSD
Prediction: Upward Movement Expected
Fundamental Analysis:
The EUR/USD pair has climbed to 1.0885 during early Asian trading on Friday, buoyed by a weakening U.S. Dollar. Market participants are closely watching the U.S. Nonfarm Payrolls report set to be released later today. This increase represents the pair's fourth consecutive day of gains, approaching the critical 200-day Simple Moving Average (SMA) at 1.0870 and the significant level of 1.0900.
Expectations are rising for a potential 25-basis-point rate cut by the Federal Reserve in the coming month. Meanwhile, the European Central Bank has recently lowered rates to 3.25%, with officials displaying caution regarding future monetary policy decisions. The resilience of the U.S. economy may help sustain the Dollar's strength in the short term.
Technical Analysis:
Should the pair continue its upward trajectory, it could reach the weekly high of 1.0887, followed by resistance levels at the 100-day and 55-day SMAs located at 1.0935 and 1.1019, respectively. The next key target is the 2024 peak of 1.1214, ahead of the 2023 high at 1.1275.
On the downside, initial support is positioned at the October low of 1.0760, followed by the psychological level of 1.0700, and then the June low at 1.0666. A sustained move above the 200-day SMA would likely enhance the bullish outlook for EUR/USD. The four-hour chart indicates a rebound, with resistance identified at 1.0887 and support at 1.0760, while the RSI hovers around 60.
XAUUSD
Prediction: Increase
Fundamental Analysis:
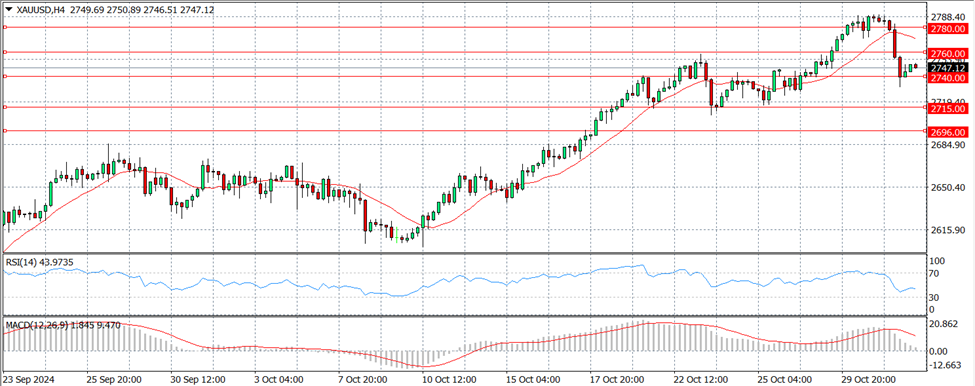
Spot Gold experienced significant selling pressure following the opening of Wall Street, retreating sharply from its record highs to approximately $2,731.45. A risk-averse sentiment permeated the markets on Wednesday after U.S. economic data indicated robust growth and a strong labor market, leading to reduced expectations for interest rate cuts. The Federal Reserve's upcoming monetary policy meeting on November 7 shows a 94.5% probability of a 25 basis point rate cut, slightly down from 95.5% the previous week. Additionally, the Bank of Japan maintained its interest rate target at 0.25%, lending support to the U.S. Dollar. Initial Jobless Claims dropped to 216K, while the September Personal Consumption Expenditures Price Index rose by 2.1% year-over-year. Market attention now shifts to the upcoming U.S. Nonfarm Payrolls report, which is projected to reveal an addition of 113K jobs in October, with the unemployment rate remaining stable at 4.1%.
Technical Analysis:
The XAU/USD pair has given up most of its weekly gains, and the daily chart suggests that the downward trend may persist, although it is not currently in a bearish phase. Technical indicators have retreated sharply from overbought levels and are trending downward, yet they remain above their midlines. The pair is still positioned above all moving averages, indicating a bullish trend, with the 20 Simple Moving Average providing dynamic support around $2,696.00.
In the short term, the 4-hour chart points to potential downside risks. XAU/USD has dipped below its 20 SMA, which has lost its bullish momentum around $2,766.00. However, the 100 and 200 SMAs are still rising below the current price level. Technical indicators have moved into negative territory, signaling the possibility of further declines ahead.
GBPUSD
Prediction: Decrease
Fundamental Analysis:
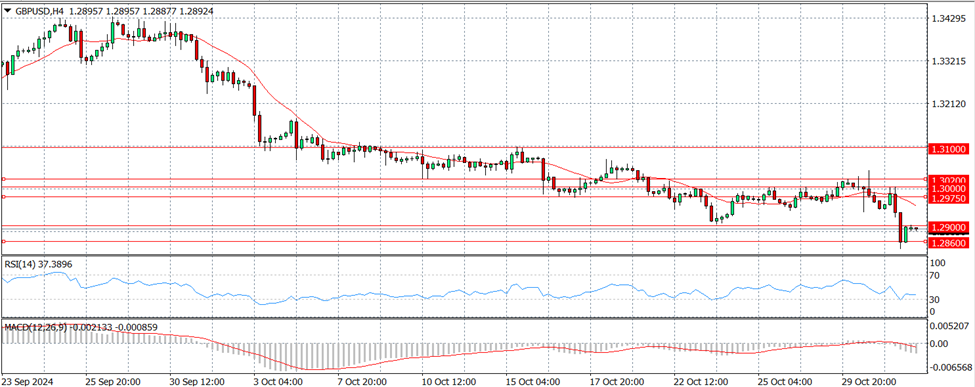
The GBP/USD pair is currently under pressure, trading around 1.2895, marking its lowest point since August 16, during early Asian hours on Friday. The recent decline followed the UK Labour government’s release of its first Autumn Forecast Statement on Wednesday. Although GBP/USD closed negatively that day, it opened slightly higher on Thursday but remains below the 1.3000 level.
Despite rising UK gilt yields post-Autumn Budget announcement, which have bolstered the Pound’s strength—evident as the 2-year gilt yield reached its highest since mid-July and the 20-year yield exceeded 4.8%—GBP/USD is struggling to gain traction. The U.S. Dollar is benefiting from a risk-averse market environment, with U.S. stock futures in decline. Market participants are also closely monitoring Initial Jobless Claims data, with expectations for a decrease to 227,000 from the previous 230,000. If claims rise towards 250,000, it could negatively impact the USD. However, GBP/USD may find it challenging to recover if safe-haven flows continue to prevail.
Technical Analysis:
On the 4-hour chart, the Relative Strength Index is hovering near 50, indicating weak bullish momentum. Immediate resistance levels are seen at 1.3020, followed by 1.3100 and 1.3140. Conversely, significant support lies at 1.2975, coinciding with the 100-day Simple Moving Average. A drop below this support level, coupled with its conversion to resistance, could lead GBP/USD to continue its decline toward the 1.2900 mark.
USDJPY
Prediction: Increase
Fundamental Analysis:
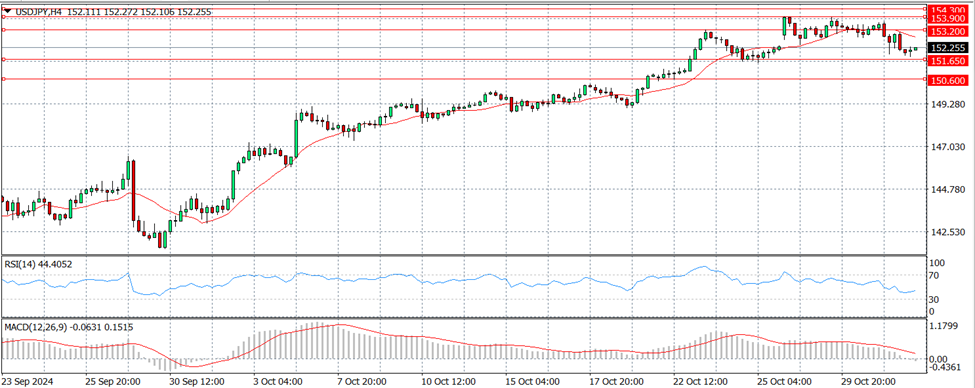
The USD/JPY pair has eased to approximately 151.95 during early Asian trading on Friday. The Japanese Yen has strengthened following remarks from Bank of Japan Governor Kazuo Ueda, which have heightened expectations for a possible rate hike in December. Meanwhile, the USD/JPY pair benefits from the robust U.S. economy, especially as other major economies show signs of slowing down. This scenario supports the view that the Federal Reserve will gradually ease interest rates, maintaining strong U.S. Treasury yields and bolstering the Dollar.
In Japan, uncertainty surrounding the upcoming elections this Sunday is contributing to volatility in the Yen. The Bank of Japan is anticipated to hold interest rates steady until the political landscape stabilizes. Additionally, U.S. consumer confidence is projected to improve for October, while JOLTS job openings may see a slight decline but are expected to remain at healthy levels.
Technical Analysis:
From a technical perspective, the USD/JPY pair is currently trading within a horizontal range as investors await the release of Friday's Non-Farm Payroll (NFP) data. Immediate support is found at 151.65, with the next level at 150.60. Resistance levels include the previous support at 152.77 and the October peak at 153.85. Despite the prevailing bullish trend, the RSI is showing a bearish divergence, indicating a potential correction may be on the horizon. Key resistance levels are noted at 153.90 and 155.10, while support levels lie at 152.50 and 151.60.
Disclaimer
Derivative investments involve significant risks and may result in the loss of the capital you invest. You are advised to carefully read and study the legality of the company, products, and trading rules before deciding to invest your money. Be responsible and accountable in your trading.
RISK WARNING IN TRADING
Transactions via margin involve products that use leverage mechanisms, carry high risks, and are certainly not suitable for all investors. THERE IS NO GUARANTEE OF PROFIT on your investment, so be wary of those who guarantee profits in trading. You are advised not to use funds if you are not prepared to incur losses. Before deciding to trade, ensure that you understand the risks involved and also consider your experience.